|
MultiFoXS Help Page
Input Fields
- Input protein: it is possible to
specify the PDB code of the input protein or upload a file in PDB or
mmCIF format. Each code is a four character PDB ID, followed by a colon and
a comma-separated list of chain IDs, e.g. 2pka:A,B. If no chain IDs are given,
all the chains of the PDB file are used.
IMPORTANT! Your input protein should contain all the atoms with proper geometry (bond length, bond angles, no steric clashes). Missing fragments can be filled in using MODELLER or the AllosMod-FoXS webserver.
- Flexible residues: a list of residues that their backbone phi and psi angles are sampled by the sampling algorithm. Those residues divide the input protein into rigid bodies and linkers. This list should contain linkers between the domains. You can use HingeProt to identify hinge regions. Please do not include flexible loops, as the server cannot handle cycles, the current implementation is limited to linear or tree-like topologies.
The file has to be in the following format:
[residue index] [chain ID][newline]
...
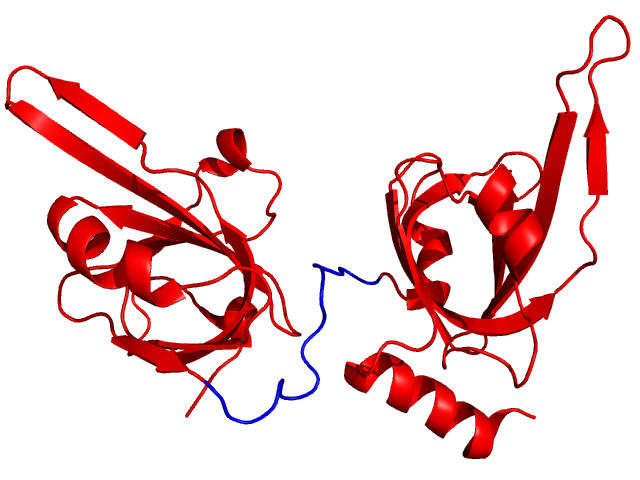
(If there is no chain ID, then residue index is sufficient).Example: for replication protein A (DNA binding domains, PDB 1fgu, chain A), HingeProt detects a hinge region between residues 299 and 300. Therefore, we will designate residues 289 to 302 as flexible residues (shown in blue below):
289 A
290 A
291 A
...
302 A
IMPORTANT! If you use TextEdit on Mac: create new file, Go to "Format" and select "Make Plain Text" (the Mac Default is Rich Text which cannot be used).
- SAXS profile: A file with experimental SAXS profile. The experimental file should have 3 columns: q, I(q) and error:
# q intensity error
0.00000 3280247.73 1904.037
0.00060 3280164.59 1417.031
0.00120 3279915.19 1840.032
0.00180 3279499.57 1566.084
Header lines should be preceded by #.
Please note that: q = (4π sin θ) / λ,
where 2θ is the scattering angle and λ is the wavelength of the incident X-ray beam. If your experimental profile does not contain an error column, the server will add 5% error with Poisson distribution.
Note, lines with zero intensities are skipped. If you profile contains negative intensity values, MultiFoXS will read in the profile until it encounters first negative intensity value.
- e-mail address: optional, the link with the
results of your request is sent to this address. If e-mail address is not provided, the link will be given after submission in the web browser. Using this link you
can view the server results.
Sample input
- Replication protein A (DNA binding domains, PDB 1fgu, chain A) PDB contains both open and closed conformations. The input SAXS profile was simulated using the closed conformation (PDB 1jmc). We start MultiFoXS form the open conformation (PDB 1fgu, chain A) and obtained the closed one:
PDB (or mmCIF)
Flexible residues
SAXS profile
MultiFoXS output - DNA ligase without DNA - multi-domain protein, data from Cotner-Gohara et al. Biochemistry 2010:
PDB (or mmCIF)
Flexible residues
SAXS profile
MultiFoXS output - Full length prion protein - a protein with 100-residue disordered region, data from Carter at al. Biophys J. 2015:
PDB (or mmCIF)
Flexible residues
SAXS profile
MultiFoXS output
Advanced Parameters
- Job name: if none is provided, the server generates a default name based on the time stamp.
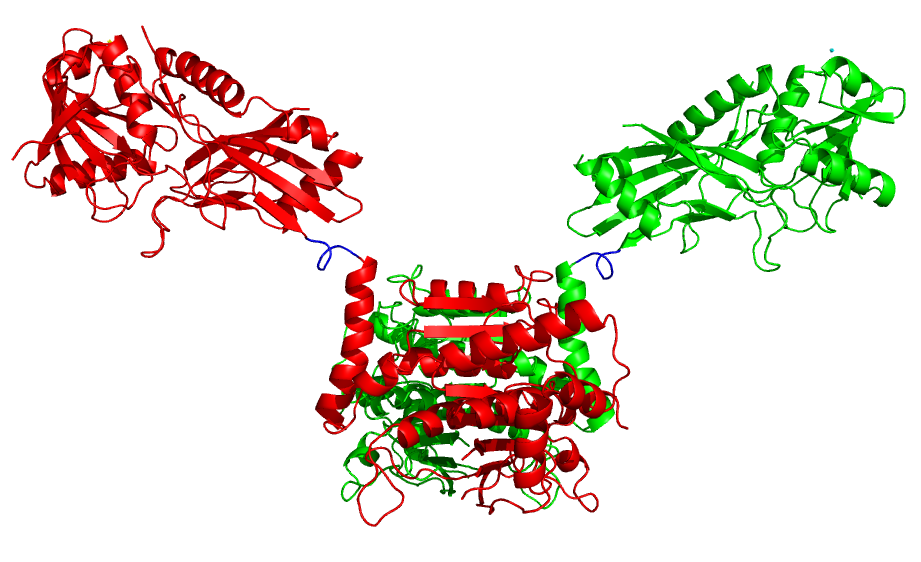
- Connect rigid bodies: by default the RRT sampling method reads in each PDB chain as a separate rigid body. Those are further broken down by flexible residues. In some cases, we might want to connect parts of the different chains into one rigid body. For example, if a protein is a dimer where each monomer consists of two domains and the first domain is the one involved in dimerization, such as ATG7 (PDB 3vh1). In this case we want to maintain the dimerization interface and move the second (upper) domain only. To achieve that we connect the first domain of the two chains into one rigid body by providing a file with a pair of residues one from each domain:
326 A 513 B
will connect the rigid body that residue 326 (chain A) belongs to with the rigid body that residue 513 (chain B) belongs to. The result will be 3 rigid bodies connected by two linkers (blue).
- Number of conformations: by default the server generates 100 conformations from the starting structure. However this is sufficient for testing your setup only. After you see that the sampling moves the structure as needed, it is necessary to re-run the server and generate 10,000 conformations. One can also try to repeat the calculation starting from the best scoring conformation from the previous calculation.
- Experimental profile units: MultiFoXS supports input profiles with q in 1/Å and 1/nm. By default the units of the input profile are determined automatically. Alternatively, the user can set the units.
Output Page
Examples of MultiFoXS output:- DNA ligase without DNA - multi-domain protein, data from Cotner-Gohara et al. Biochemistry 2010
- Full length prion protein - long disordered fragment, data from Carter at al. Biophys J. 2015
The ouput of MultiFoXS is a list of best scoring multi-state models for each state number. The bar plot on the left displays the lowest χ score for each state number. The middle plot displays the fit of the best scoring multi-state model to the input profile (black dots) for each state number. The best scoring single structure fit is green, the 2-state fit is red, the 3-state fit is blue, and the 4-state fit is cyan. Using show/hide button it is possible to display/hide the profile for a specific multi-state model. The plot on the right displays the distribution of radius of gyration among top 100 best scoring multi-state models of each size. The color coding is the same as for the fit plots. This plot can help to determine the number of states by looking at the convergence of the peaks (see Carter et al. Biophys J 2015 for details). The best scoring multi-state models for each number of states are displayed next. The color coding is identical to the fit plot. For each multi-state model the χ value, c1 and c2 are indicated. Each structure is displayed in a separate window along with the link to the PDB file, radius of gyration, and the corresponding weight.
The user can download all the conformations generated by RRT sampling in PDB format and MultiFoXS output files following links on the top of the page. More information about output files is here.
If you use MultiFoXS (version main.af0ac5f), please cite:
Contact: